

This is the first in a series of blog posts on my journey through video game hacking and security. I plan to go through any aspect of this domain that piques my interest. Who knows what I’ll find! This particular post focuses on a simple networking lab setup that I will use a lot going forwards as I investigate just what these consoles are sending through the air and over the wire.
But Why?
Gaming Consoles do a lot of stuff aside from just playing games. These days they can integrate with social media platforms, make purchases with your credit card information, handle and transmit various forms of personally identifiable information, collect analytics, allow online chatting, and online play, and possible even more. That’s a lot of stuff… What I want to know is how are modern gaming consoles handling this information, and possibly even how are many games themselves handing such integrations as micro-transactions.
Let’s get into it shall we?
Network Setup / Structure
My networking lab for these series of console hacking and network analysis experiments is comprised mostly of networking gear that I had lying around my house. Really the only special purpose device that I need to purchase for this was a LAN TAP. I opted for the Throwing Star Pro LAN Tap which you can see here(link to great scott page). As you will see in the list of devices used below, I opted to bully the Nintendo Switch to start out. Again, this is for the most part just comprised of stuff I had lying around my house.
Devices:
- APU running OPNSense (not needed for this but I like it)
- Intel NUC running Ubuntu 18.04 (also not needed for this, but I needed a device to tap from)
- Throwing Star LAN Tap (or an equivalent device will be needed)
- Two Routers that can act as a WAP or an actual WAP
- A Nintendo Switch (or another console that can connect to things via WiFi)
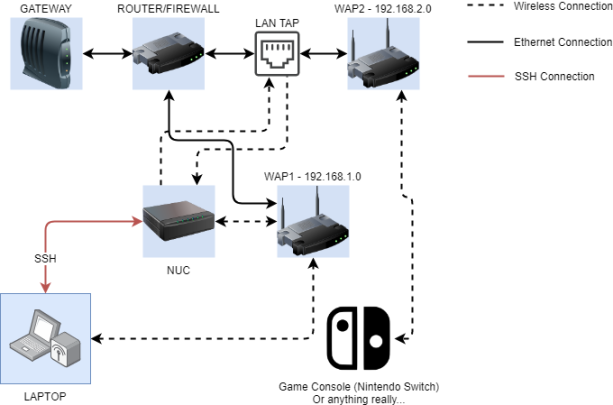
You might be wondering after looking at that network diagram “why tap from the nuc via ssh from your laptop?” Well I’m lazy and I don’t want to have to tether my laptop to the LAN tap. This setup allows me to SSH into the NuC and work that way from anywhere in my home 😀
Firewall Configuration
I needed to do some setup on the OPNsense router device to get going. Namely I did the following:
Configured the additional ethernet adapter on the device to serve as a second LAN port so that I could connect a second WAP. The router device only had 3 ethernet ports available, one of which needed to be used for a WAN connection.
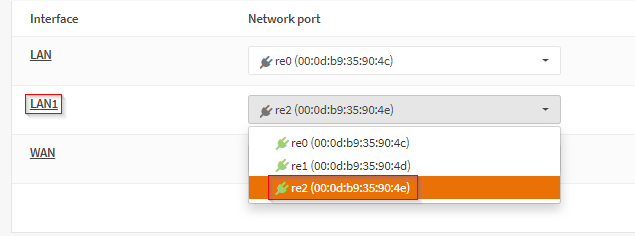
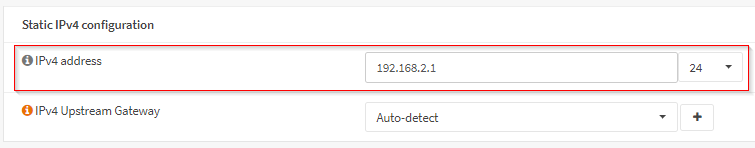
Assigned the LAN adapters their IP ranges of 192.168.1.1/24 and 192.168.2.1/24 respectively.
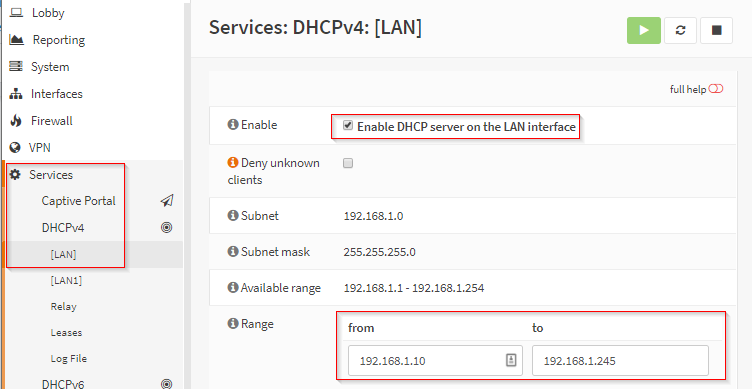
Setup DHCP on the LAN adapters so that devices connected to the WAPs could lease IP addresses.
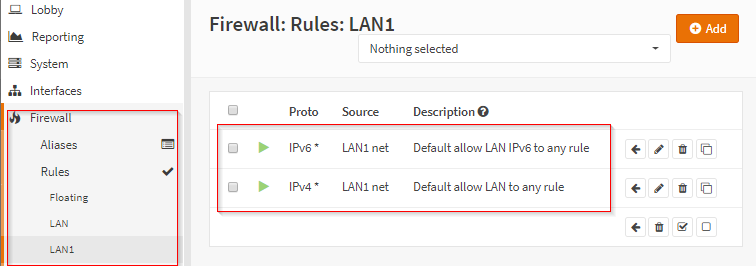
Configured the firewall rules of the LAN1 adapter to allow it to egress to any IP, port, and gateway. LAN was auto configured for this when installing OPNsense.
Once I had done all of that the router/firewall and connected my two WAPs to their respective adapters, the router/firewall was ready to start accepting wireless device connections on both of the configured subnets!
Connect the NuC to WAP1
In order to get the NuC connected to WAP1 I had to hook a keyboard and a monitor up to it and then log-in as the user which was configured during the OS install. After that I opted to use NetworkManager to manage the devices network connections and get it connected to the WAP. I installed NetworkManager with a simple apt command and then started the daemon after it finished installing.
| $ sudo apt install NetworkManager$ start NetworkManager |
Once that was done I listed the available wifi connections using nmcli, the cli wrapper around NetworkManager.
| $ nmcli d wifi list |
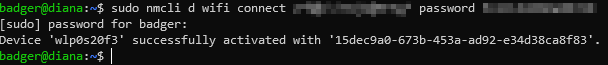
I then noted the SSID of WAP1 and used nmcli to connect to it using the PSK (pre-shared key) I setup when configuring it.
| $ nmcli d wifi connect <SSID> password <password> |
The following screenshot shows the results of the previous command. If you’re following along to set up your own lab then you should see a similar output.
SSH’ing to the NuC
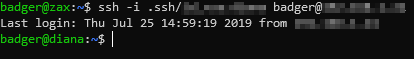
Now that the NuC had been connected to WAP1 I was able to SSH into it using a ssh key-pair that I had previously provisioned with the following SSH command.
| $ ssh -i path/to/rsa/key [username@]host |
Setting up to pull from the tap
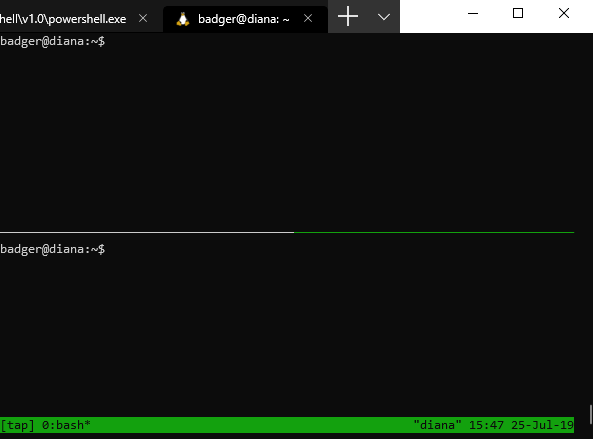
Now that I could remotely connect to the NuC via SSH through WAP1 I setup a tmux session to run tcpdump on both ethernet interfaces which went from the NuC’s built-in interface and the USB-C ethernet adapter interface to the eno1 of the LAN Tap.
| $ tmux new – s tap |
The screenshot below shows what the split tmux session looks like when attached to it. If you’re curious, you can create a split pane easily by doing Ctrl-B + “ to create a horizontal split or Ctrl-B + % to create a vertical split.
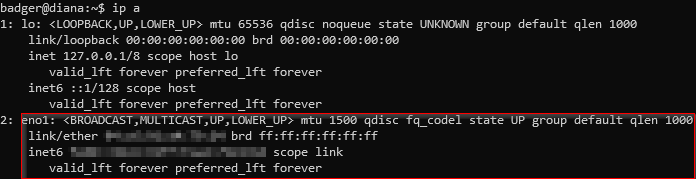
In order to get the full picture of what was going over the wire between WAP2 and the Router I had to capture on each interface independently because the TAP has one ethernet interface for tapping egress traffic and another for tapping ingress traffic. To be able to do this I created a split pane within my tap tmux session, one for each interface. I then had to figure out which interfaces to listen to. This was done with a simple ip a command. The following two screenshots show the interfaces that I needed to listen on; eno1, and enx00e04c680cfd. The ladder interface is the USB-C ethernet adapter I needed due to the NuC only having one built in ethernet port.

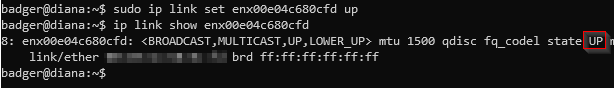
As you can see in the previous screenshot the enx00e04c680cfd interface was actually in a DOWN state. So, I had to bring the interface up with the following command.
| $ ip link set enx00e04c680cfd up |
You can see in the screenshot below that the interface was in an UP state after running the previous command.
Connecting the Nintendo Switch
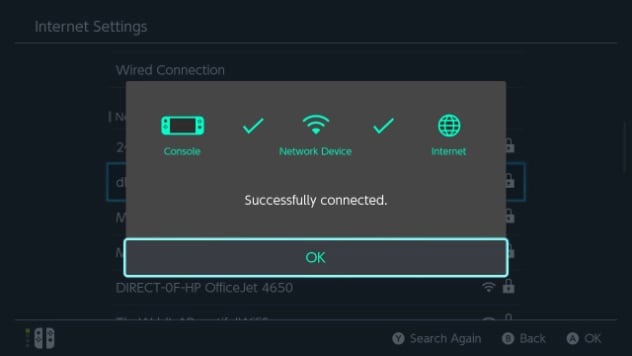
Since I was going to capture and analyze the traffic generated by a game console, and I happened to have a Nintendo Switch laying around, I decided that this was the first console I would pick on. So, I quickly got the Switch connected to WAP2, the end result of which can be seen in the following screenshot.
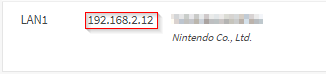
Now that the Nintendo Switch was on the lab network, I needed to know what IP address it was given. To find that I logged into my router and checked the DHCP leases for the subnet 192.168.2.0, which is the subnet I assigned to WAP2. The switch was leased the internal IP address of 192.168.2.12. This can be seen in the next screenshot. I could have also gotten this info from the Switch itself under the internet settings.
Actually tapping from the tappy tap which taps tappingly
Finally I had everything in place to start capturing the traffic that the Nintendo Switch generated through WAP2 in a way that allowed me to avoid tethering my laptop to the janky home lab setup I had frankensteined together (pictured below).
So, I attached back to my tmux session with the following command.
| $ tmux a -t tap |
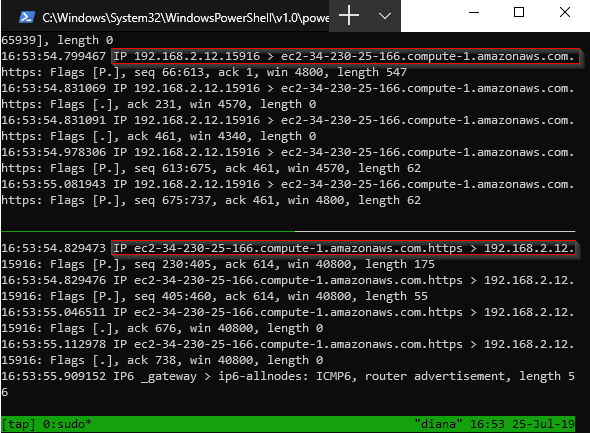
Then I simply setup two simple tcpdump instances simply dumping whatever came across the two interfaces. The following screenshot shows, in the top tmux pane, the output of sudo tcpdump -i eno1, and the second pane shows the output of sudo tcpdump -i enx00e04c680cfd. I’ve highlighted two flows one of which shows that the Nintendo Switch was reaching out an AWS EC2 endpoint at ec2-34-230-25-166.comput-1.amazonaws.com over HTTPS and the second showing the same AWS EC2 endpoint sending traffic back to the Nintendo Switch. Very interesting 🤔
That’s where I’m going to leave it for now, since this is just part 1 – the setup. In part two of this blog series I will explore my findings as I perform various capturing scenarios and follow that up with an analysis of the traffic with various tools such as Wireshark and Scappy.
I hope you enjoyed this blog post and that you come back for the follow up posts as I begin to really play around with this little lab setup 🙂